
Page 8 - Saffron_Leaf_Brochure_Final copy
P. 8
Commodity
Outl k
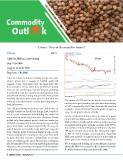
Chana - End of the road for bears?
Chana BUY
CMP: Rs 3803 (As on 02nd Feb 2018) Chana
Buy: > Rs 3860
Targets: Rs 4120-4350
Stop loss: < Rs 3680
After its return to futures trading in July last year, The stance of ADX will be the key to a reversal here
Chana prices got a couple of bullish spells till and we are eagerly waiting it to get above the reading
August. Came September and the aggressive rise of ‘20’. Importantly, ADX has attained the positive
just vanished. It has since then performed poorly crossover of its directional threads which is again a
and one can easily figure out the kind of drubbing very crucial point in favor of bulls.
it received in last five months by just having a look
at technical charts. During this period Chana prices On the fundamental front, there is news of a good
tumbled by more than forty percent and that too crop in MP and Maharashtra. Arrivals have started in
without any major round of relief providing bounce Maharashtra in small pockets whereas in MP, we may
back in between. see farmers hitting the ‘mandis’ anytime after 15th of
this month. Arrivals in Rajasthan will start only after
Like ‘all good things come to an end’, nature has an 15th April. Despite these facts, the ‘Bhavantar Yojna’
equally viable law for all bad things. Last couple of in MP & recent budget announcement regarding
week’s price movement is indicating the arrival of MSP may provide enough room for a relief rally as
much needed relief rally from here. However, Chana lower prices are slowly leading to cartel trading.
added only three percent gains in last two weeks but
the kind of consistency that built-up during intraday We recommend buying in Chana March contract
price movement and most importantly the way in above Rs 3860 for targets in the range of Rs 4120-
which buyers successfully kept technical supports Rs 4350. Maintain stop loss below Rs 3680.
intact despite profit booking at higher levels, are the
reasons why we are counting on the pulse. Two back
to back ‘Inverted Hammer’ candlesticks on weekly
chart are reflecting the same. Momentum indicators
like RSI and MACD are already marching ahead than
the prices, thus creating a strong positive divergence
while being in an equally positive looking crossover.
8 ARIHANT CAPITAL ¡ february 2018