
Page 6 - 1800197_Value_Plus_March1
P. 6
Commodity
Outl k
Zinc–Intothewaveofundercurrent
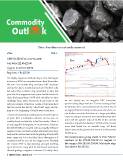
Zinc SELL
CMP: Rs 220.15 (As on 02nd Mar 2018) Zinc
Sell: @ Rs 222.80-223.00
Targets: Rs 215.10-209.50
Stop loss: > Rs 227.20
The highly impulsive bullish rally in Zinc that began we can clearly see an irregular ABC correction
in January 2016 has completed more than 26 months. pattern taking shape with the ‘C’ wave nearing a final
We saw a six months long corrective ABC structure breakdown after a successful breach of a trend line. If
during the above mentioned period of bullish rally we apply Fibonacci study on this wave structure, we
but when this corrective leg completed in May last can further conclude that there is a huge possibility
year, the Zinc juggernaut just grew fast & furious to of prices seeing a reciprocal movement that may take
claim the longest leap of 50% with virtually no major prices till the golden ratio of 61.8% of the current
challenge from bears. However, if one looks at the impulsive leg which actually is 161.8% of the second
price movement of last few weeks, it becomes clear wave that lasted for six months long. All these
that the metal has hit the ‘tired bull’ stage and we factors are pointing towards a wave of undercurrent
may see the beginning of fourth wave from here. building up.
A series of candlesticks with large movement in terms We recommend going short in Zinc March
of price BUT a lackluster outcome can be seen on contract at Rs 222.80-223.00 for targets in
weekly chart, particularly in last five weeks. There is the range of Rs 215.10-209.50. Maintain stop
a huge negative divergence in momentum indicators loss above Rs 227.20.
like RSI & MACD coupled with an equally effective
negative crossover that has taken place just a few days
back and if our forecast for the beginning of the fourth
wave turns out to be real then these divergences &
crossovers will be seen as the trigger point. Notably,
the crucial ADX is also showing strength building
up in the bears’ camp with its directional movement
threads getting a negative crossover. On daily chart,
6 ARIHANT CAPITAL ¡ march 2018