
Page 7 - 2426_Value_Plus_Dec123
P. 7
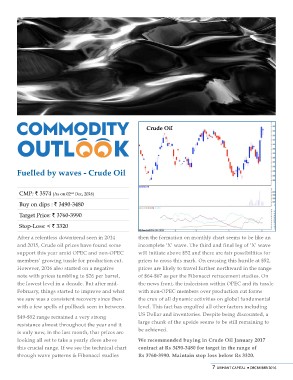
Crude Oil

Fuelled by waves - Crude Oil

 CMP: ` 3574 (As on 02nd Dec, 2016)                then the formation on monthly chart seems to be like an
                                                   incomplete ‘X’ wave. The third and final leg of ‘X’ wave
 Buy on dips : ` 3490-3480                         will initiate above $52 and there are fair possibilities for
                                                   prices to cross this mark. On crossing this hurdle at $52,
 Target Price: ` 3760-3990                         prices are likely to travel further northward in the range
                                                   of $64-$67 as per the Fibonacci retracement studies. On
 Stop-Loss: < ` 3320                               the news front, the indecision within OPEC and its tussle
                                                   with non-OPEC members over production cut forms
After a relentless downtrend seen in 2014          the crux of all dynamic activities on global fundamental
and 2015, Crude oil prices have found some         level. This fact has engulfed all other factors including
support this year amid OPEC and non-OPEC           US Dollar and inventories. Despite being discounted, a
members’ growing tussle for production cut.        large chunk of the upside seems to be still remaining to
However, 2016 also started on a negative           be achieved.
note with prices tumbling to $26 per barrel,
the lowest level in a decade. But after mid-       We recommended buying in Crude Oil January 2017
February, things started to improve and what       contract at Rs 3490-3480 for target in the range of
we saw was a consistent recovery since then        Rs 3760-3990. Maintain stop loss below Rs 3320.
with a few spells of pullback seen in between.
                                                                                         7 ARIHANT CAPITAL ¡ DECEMBER 2016
$49-$52 range remained a very strong
resistance almost throughout the year and it
is only now, in the last month, that prices are
looking all set to take a yearly close above
this crucial range. If we see the technical chart
through wave patterns & Fibonacci studies